Customized Text Classification for Excel
In the previous tutorial we published about Text Classification and MeaningCloud’s Excel add-in, we showed you step by step how to carry out an automatic text classification using an example spreadsheet.
In this tutorial, we are going a bit further: instead of just using one of the predefined classification models we provide, we are going to create our own model using the model customization console in order to classify according to whichever categories we want.
We are going to work with the same example as before: London restaurants reviews extracted from Yelp. We will use some data from the previous tutorial, but for this one we need more texts, so we’ve added some. You can download the spreadsheet here if you want to follow the tutorial along.
If you followed the previous tutorial, you might remember that we tried to use the IAB model (a predefined model for contextual advertisement) to classify the different restaurant reviews and find out what type of restaurants they were. We had limited success: we did obtain a restaurant type for some of them, but for the rest we just got a general category, “Food & Drink“, which didn’t tell us anything new.
This is where our customization tools come in. Our classification models customization console allows you to create a model with the categories you want and lets you define exactly the criteria to use in the classification.
So how do we create this user model?
Step 1: Create the first version of your model
1.1 Create a model
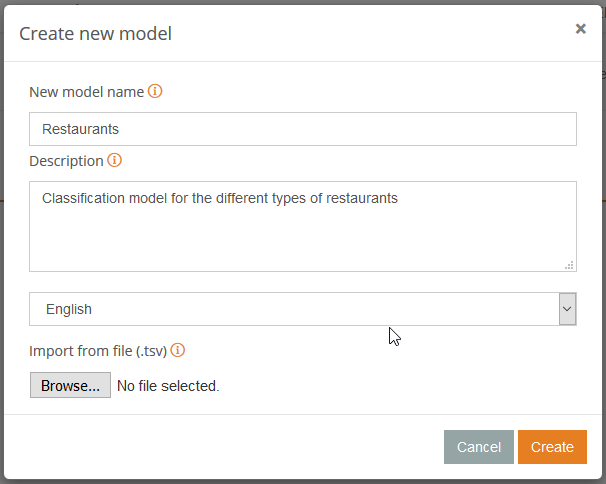
To do this, just access the models dashboard (available once you log in to your MeaningCloud account) and click on the big plus sign.
It will open a dialog where you can define the name of your new model (in our case we are calling it “Restaurants“) the language in which we are creating it (English), and optionally, a description of the model’s purpose.
1.2 Add categories
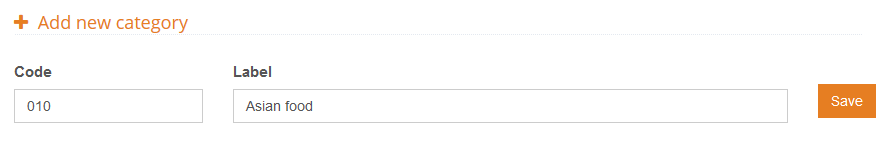
Once we have created the model, we can start adding the categories that we are going to use to classify our texts. We could define numerous categories, depending on the level of precision we would like to achieve, but in this first iteration we are going to focus on five categories: “Asian Food“, “Italian Food“, “Mexican Food“, “Fish & Chips“, and “American Food“.
To create a category, we need to determine two things: its name (or label) and the code associated to it (its univocal identification within the model). In the following image, you can see how we are going to create the category for “Asian food“:
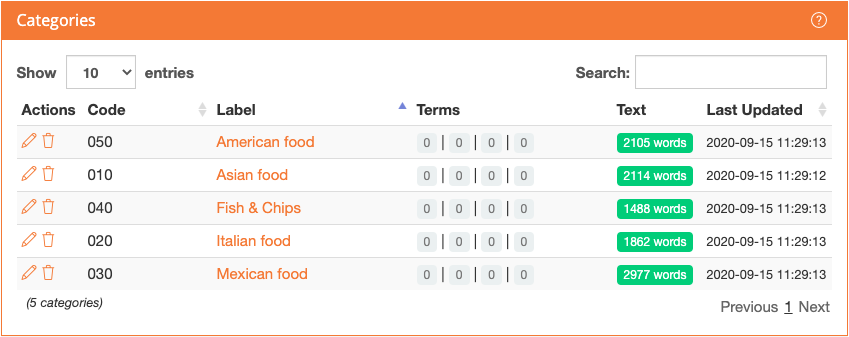
These are the values we are using to define the five categories we’ve mentioned:
- 010: Asian food
- 020: Italian food
- 030: Mexican food
- 040: Fish & Chips
- 050: American food
By creating these categories, we’ve defined the different “boxes” in which our texts are going to be sorted, but we still have to tell the system how to decide in which box to put the texts we want to classify.
In other words, we need to define the criteria for each one of the categories we’ve created.
1.3 Add the classification criteria
To set the criteria for a model we have three possibilities: using training texts (statistical model), using rules (rule-based model) or using both combined (hybrid model). You can find some tips on which one to use in the documentation. For our scenario, we are going to use a hybrid model: we have lots of example texts, and it seems easy to add specific terminology for each one of the categories to improve the results.
The spreadsheet available to download at the beginning of the tutorial features several sets of texts that we are going to use to train and evaluate the model. There are four different sheets: TrainingA, Training B, TestA, and TestB. TrainingA is the same set of texts we classified in the previous tutorial, and we are going to use it as the first training text of the model.
To add training text to a category, just access the category view and copy the texts in the section at the bottom, the Training text section. This is what the categories look like after adding the texts from TrainingA:
If you do not want to define the categories yourself at this time, you can download this file and import it directly into your empty model using the default configuration that appears in the import dialog.
Step 2: Validate your model
2.1 Use the model from the Excel add-in
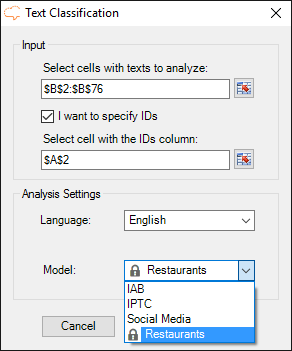
Now that we have defined the first version of our model, we can use it to carry out automatic text classification with the Excel add-in according to the criteria we have chosen.
Configuring it is very easy: when you click on the text classification button, the models created with the license key you have configured in the Settings section of the add-in will appear automatically in the model field.
You just have to select which model you want to use, in our case “Restaurants“, and then click on Analyze to start the classification.
After clicking on Analyze, the process will launch, creating in your spreadsheet a new sheet called Text Classification.
By default, the text classification configuration outputs just one category for each text, but you can change it if you want in the advanced configuration section.
2.2 Evaluate your model
Thanks to being able to classify texts with the Excel add-in, the process of evaluating our model becomes very easy.
We will carry out an iterative process to analyze some texts and then evaluate the performance of our model. This information will serve us as feedback until we reach a satisfactory performance level. With this in mind, we are going to evaluate the model we trained with the TrainingA set using the texts contained in the Test set.
If we analyze the texts selecting the column with the manual tag as the ‘ID‘, we will obtain a new sheet where we can directly compare the result and the manual tag.
To obtain a quantitative measurement of this comparison, we can easily add a column to the results where to output “1” when the result given is correct (that is, equal to the value of the first column), and “0” when it isn’t.
We can easily do this with the “IF” function. For the first text in the results the formula would be the following: IF(E2=A2;1;0)
If we drag this formula down the column and apply it to all our results, we can sum them at the bottom, and obtain how many are correct.
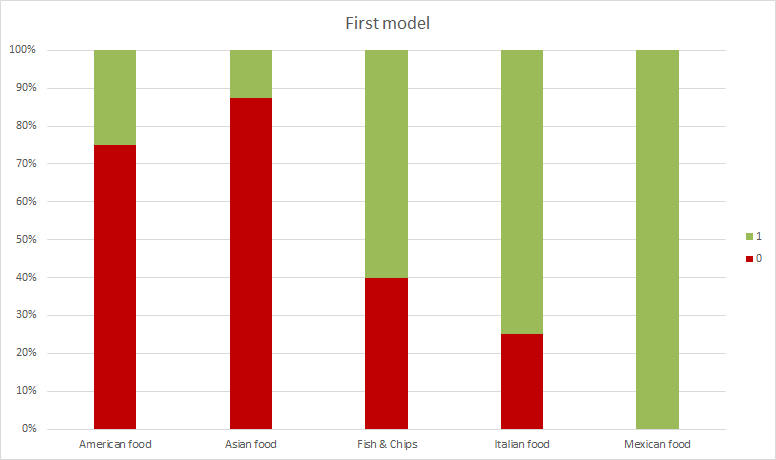
We get 23 correct out of 42, roughly a 54%, which seems to indicate we need to keep training our model. We can also create a chart such as the one on the right, to see the results by category and identify which ones are more problematic.
The configuration we’ve used to insert this pivot bar chart is the following:
- In the Axis fields area, we’ve added the field ID.
- In the Legend fields area, the field Result, which is the additional column we have created to compare the result to the manual tag.
- In the Values area, the field Result configured as “Count of Result”.
Step 3: Optimize your model
3.1 Optimize using training text
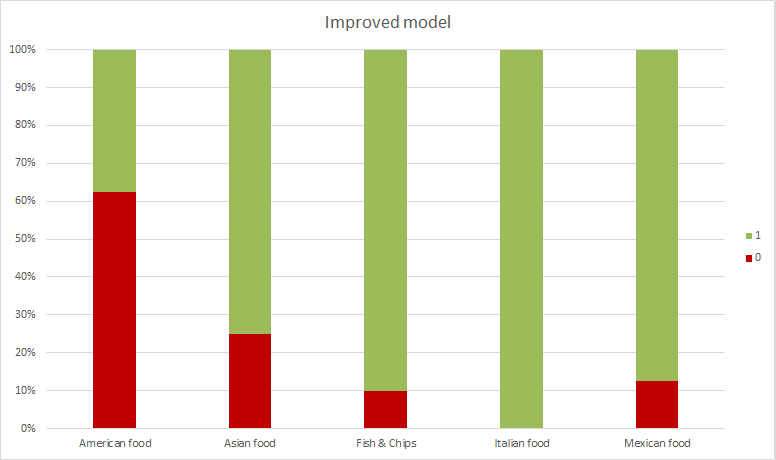
The first thing we are going to do to improve these results is to add more training texts to the model. We are going to add the texts from the TrainingB set — the ones we’ve just used to evaluate — in the same way we added the ones from TrainingA in Step 1.3.
On the right, we’ve included a new chart where we can see that in this new evaluation the results have improved. In this case, 33 out of 42 are correct, around 79%, but we can do better.
You may have noticed that, until now, we’ve only trained the model using training texts, which means that we have not used a hybrid model yet, but a statistical one (you can download this file with the updated model, and import it directly into your empty model using the default configuration that appears in the import dialog).
When we check the texts for which the model has not provided the correct answer, we see that most of them could be easily fixed by adding rules to the categories (for instance, adding “American style” as a marker for a review that should be classified as “American food“), so that’s what we are going to do next.
3.2 Optimize using rules
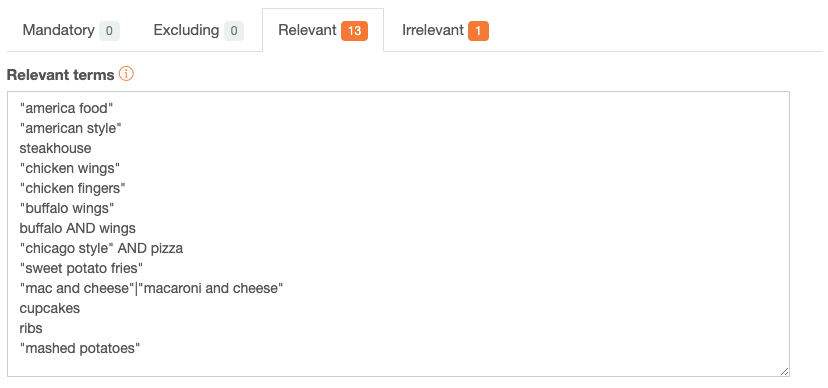
There are four types of rules we can define for a category: positive terms (mandatory terms that have to appear in the text in order to classify it into a category), negative terms (which exclude a text that contains any of them from a category), relevant terms (add weight for that category), and irrelevant terms (decrease weight for that category).
In this case, we are going to use only relevant and irrelevant terms as positive and negative terms are much more restrictive. This is an example of the rules added to the “American food” category:
As we did before, we will not evaluate the new results with the collection of texts we’ve used as feedback, so once we’ve added the rules to our model (click here to download the model with the rules we’ve defined and import it into your account).
In this last evaluation, we obtain 41 correct results out of 42, which means a precision of 98%. Not bad!
You can repeat this optimization process as many times as you consider necessary, although it’s important to consider that every scenario/domain has its own limitations, usually coming from the richness and the ambiguity of the terminology used in it.
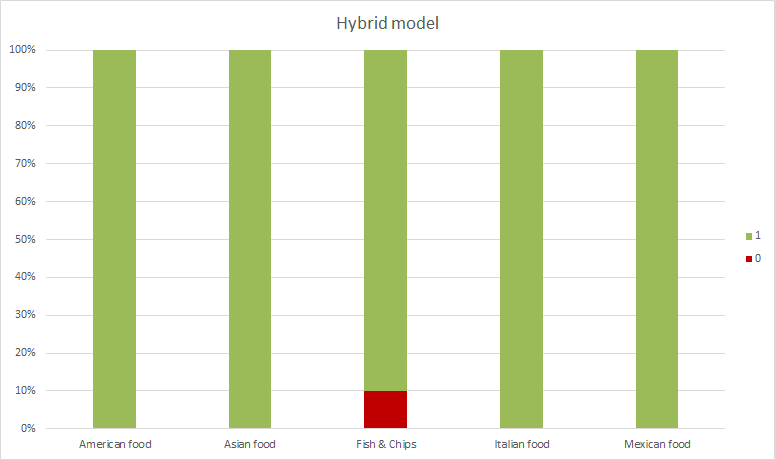
If we check the two misclassified reviews of this last evaluation, we see that there are no references unambiguous enough to let us guess the type of restaurant they are. In these cases, the fact that the model is not able to determine the type of restaurant (nor us, for that matter) is quite reasonable.
As you can see, defining your own model is quite easy, specially with the help of our Excel add-in to make the training and optimizing process more agile.
If you have any questions, we’ll be happy to answer them at support@meaningcloud.com.

2 thoughts on “Text Classification in Excel: build your own model”
Hi … for your text classification API, I assume your model uses a Niave Bayes algorithm? I’ve got a module built on MonkeyLearn that works well with Bayes, but our small scale doesn’t justify paying their API fee. I hope to transfer my training samples (only about 40 in 3 categories) to your platform and see how it works. Thanks! — Steve
Hi steven how it worked?