While it is obvious that the priority during this pandemic is to cure the sick, to prevent new cases from surfacing and to ensure there are economic and social measures in place to help the people and businesses most afflicted overcome the current situation; without a doubt, in the near future, the analysis of content related to the coronavirus that has been generated by the media and social network users will be the object of research for numerous disciplines such as sociology, philology, linguistics, audio-visual communication, and politics, to name a few.
At MeaningCloud we want to do our bit in this area, by applying our experience and our Text Analytics solutions to analyze the enormous volume of information in natural language, in Spanish and in other languages, in Spain and in other countries, given that, unfortunately, this is a global crisis.
This first article in the series centers on the thematic analysis of content that has been generated in Spanish by digital media platforms in Spain over the last month, how it has evolved during this period of time and the informative positioning of the main media platforms in Spain.
These other articles (only available, at the moment, in Spanish) analyse conversation topics on Twitter in Spain (both from the hashtags and general topics perspective and also applying a specific thematic categorization) and the linguistic analysis of presidential speeches related to this crisis.
Analysis corpus
This analysis focuses on news items published by the main media platforms with a digital presence in Spain, at a national level, from Tuesday 3rd March 2020 to Monday 13th April 2020, totaling 42 days.
 To download the content we have used the services of one of our technological partners, Webhose.io, a world-leading content provider for media, blogs, discussion forums, reviews and content on the Dark web, which has provided us well with the news published within the timeframe aforementioned.
As always, there are discrepancies in the measurement of the dissemination/popularity/audience (and without the intention of participating in the debate), we have compiled a list of 30 of the most important platforms according to accord between OJD (Oficina de Justificación de la Difusión), EGM (Estudio general de medios), Prensa Digital, Toda la Prensa and TNRelaciones:
europapress.es, elespanol.com, abc.es, elmundo.es, lavanguardia.com, lavozdegalicia.es, elpais.com, publico.es, eldiario.es, okdiario.com, elplural.com, elboletin.com, estrelladigital.es, libertaddigital.com, huffingtonpost.es, periodistadigital.com, republica.com, mundiario.com, lainformacion.com, larazon.es, madridiario.es, elconfidencialdigital.com, diariocritico.com, elindependiente.com, que.es, elconfidencial.com, infolibre.es, elsaltodiario.com, vozlibre.com, vozpopuli.com
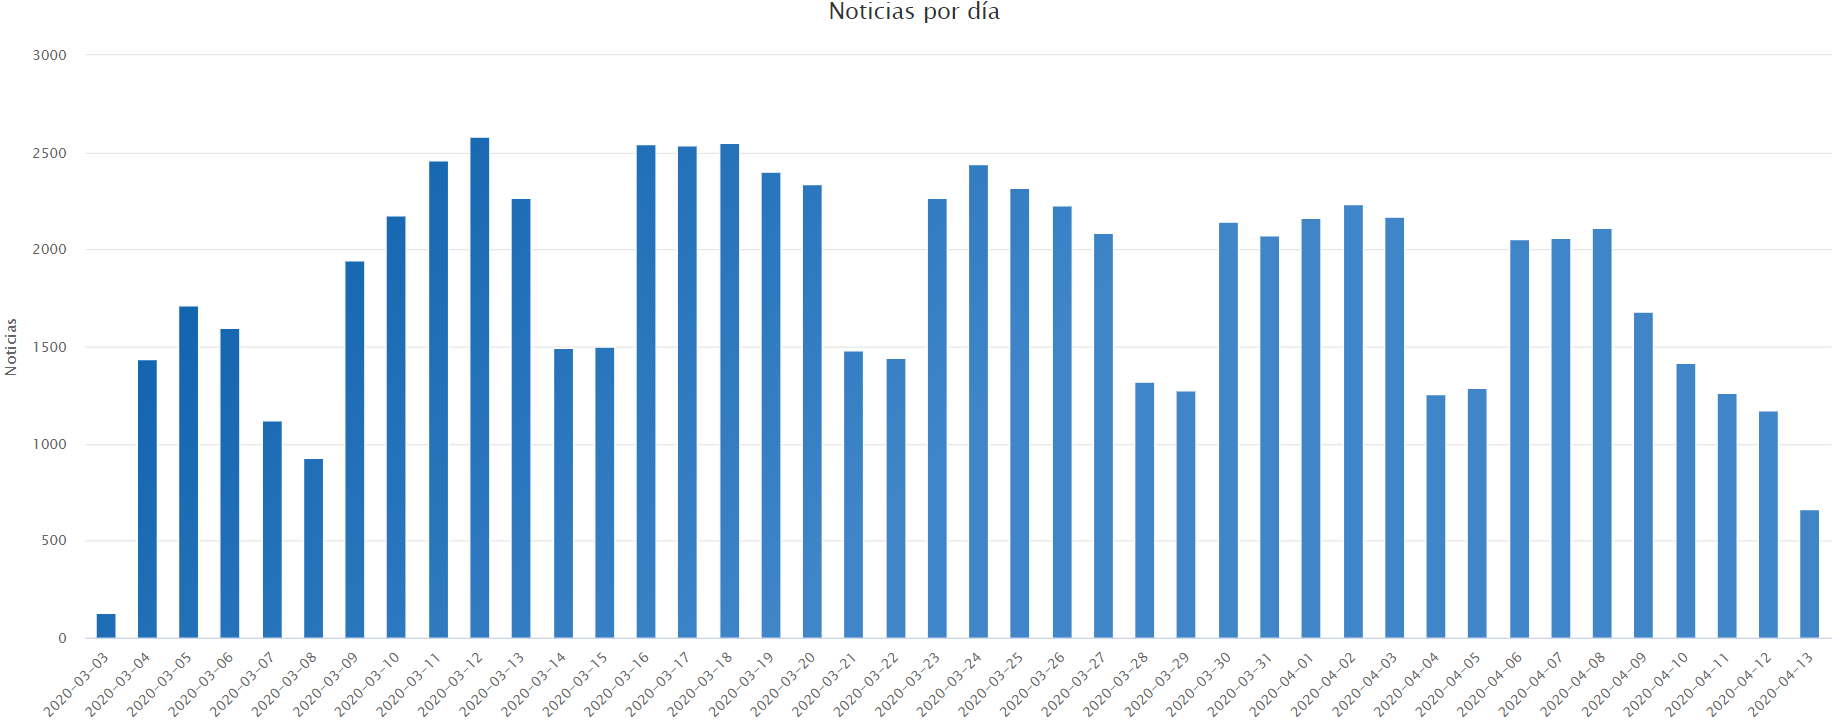
In total we have obtained 113 263 news items over the 42-day timeframe, an average of 2 697 items per day. The distribution of the number of news items per day is shown in the figure below, where it can be seen that the distribution follows the typical daily vs. weekend pattern.
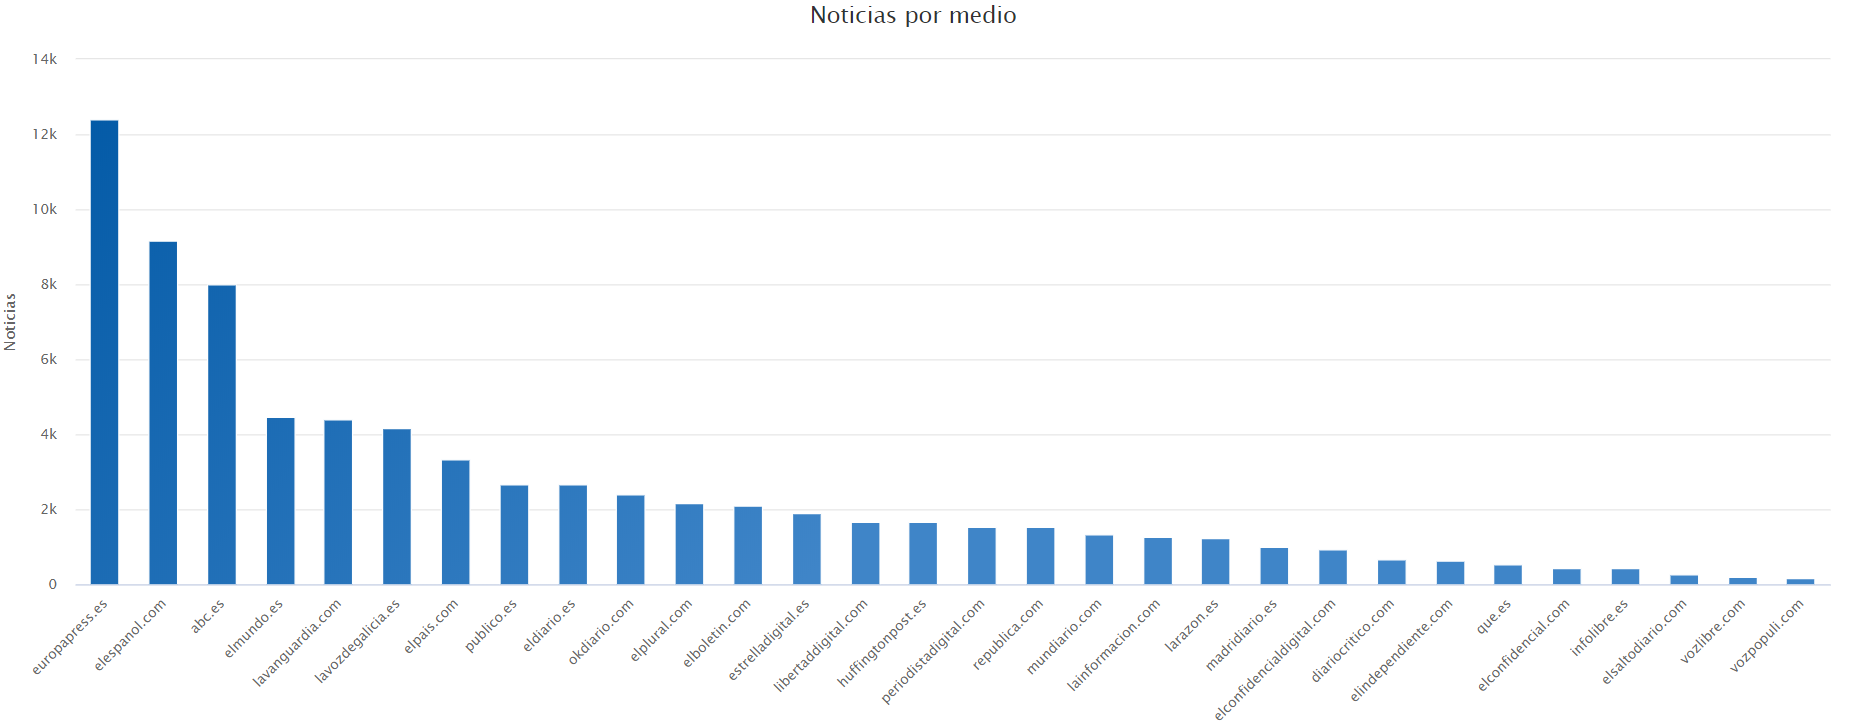
The following table shows the number of news reports obtained from each media outlet. The most prolific source is Europa Press, followed by El Español and ABC, and with the others far behind.
Thematic Analysis with standard IAB and IPTC models
Following on from this, we have used our automatic text categorization (classification) engines to carry out a thematic analysis of the news headlines. Although we have the entire news articles at our disposal, for the purpose of this analysis it is worth sticking with the analysis of news headlines alone.
At MeaningCloud we offer two text categorization (Text Classification and Deep Categorization) APIs, each with distinct functionalities for model construction, which offer two public models useful for news thematic categorization:
- The IAB (Interactive Advertising Bureau) model Tech Lab Content Taxonomy, widely used for the content classification in the advertising market, which in version 2.0 (our implementation) has 370 categories at 2 levels.
- The IPTC (International Press Telecommunications Council) Model for news categorization, which has 1388 categories at 3 levels (subject code taxonomy).
IAB model
As technology is not accurate, only 76 318 news receive a thematic categorization, 68% of the total. This is quite good, considering that it is generic, general-purpose model, not specifically trained for this domain, in which only headlines are used, and considering that IAB does not have 100% thematic news coverage.
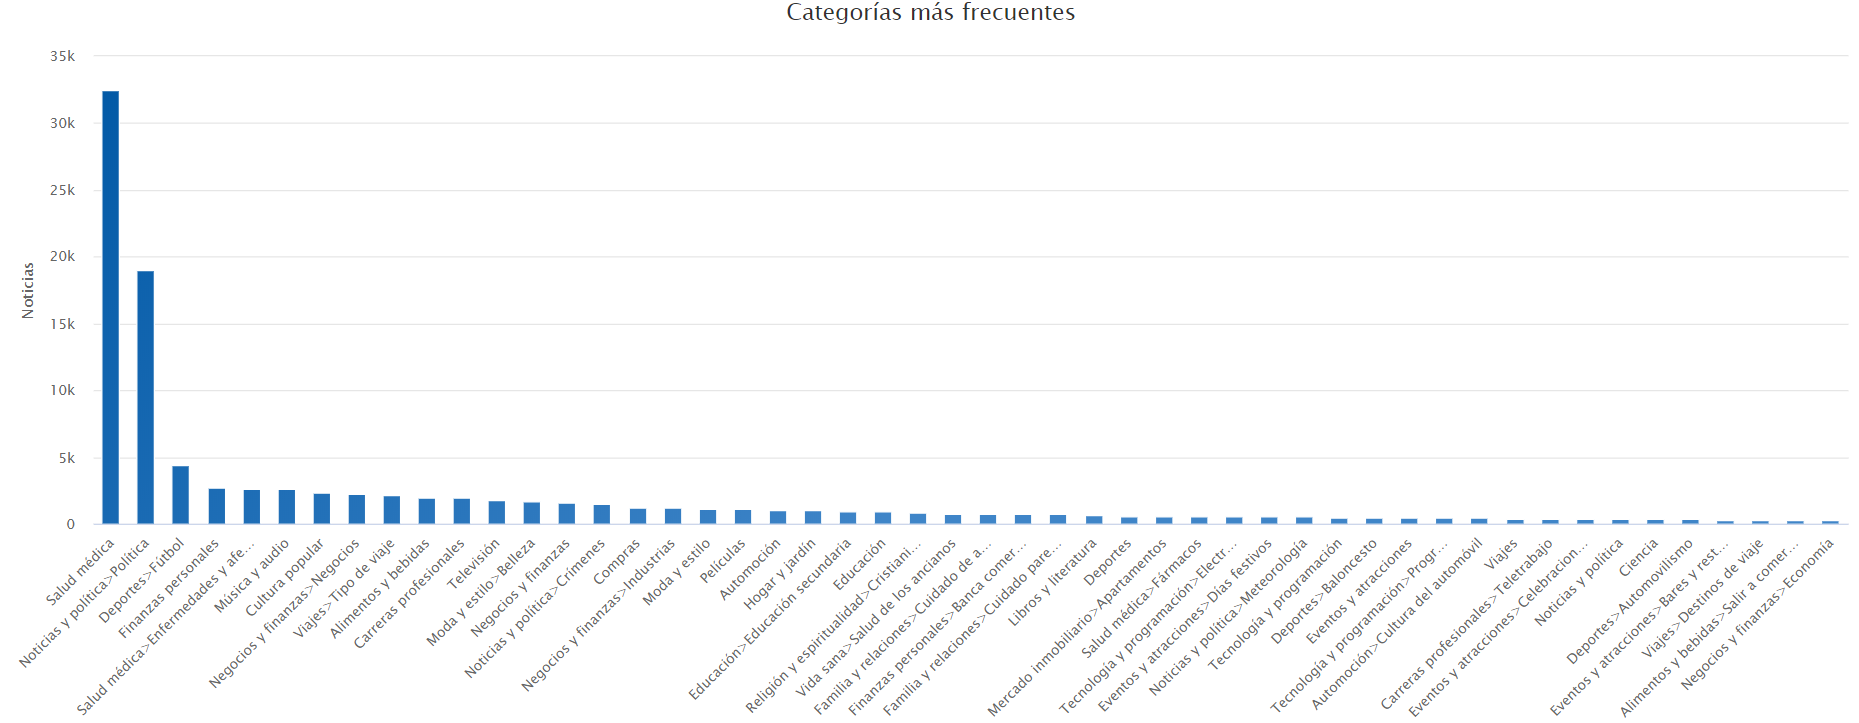
The following figure shows the overall thematic distribution of all news generated during the period of study, employing the IAB model. It can be seen that, with this generalist model, the most frequent categories are Medical Health [Salud médica] (32 446 news items, 43% of the total), News and Politics>Politics [Noticias y política>Política] (19 042 news items, 25% of the total) and Sports>Football [Deportes>Fútbol] (6% of the total), which is in line with society’s perception. The table shows a typical long tail distribution, with the most infrequent of categories at the end of the graph.
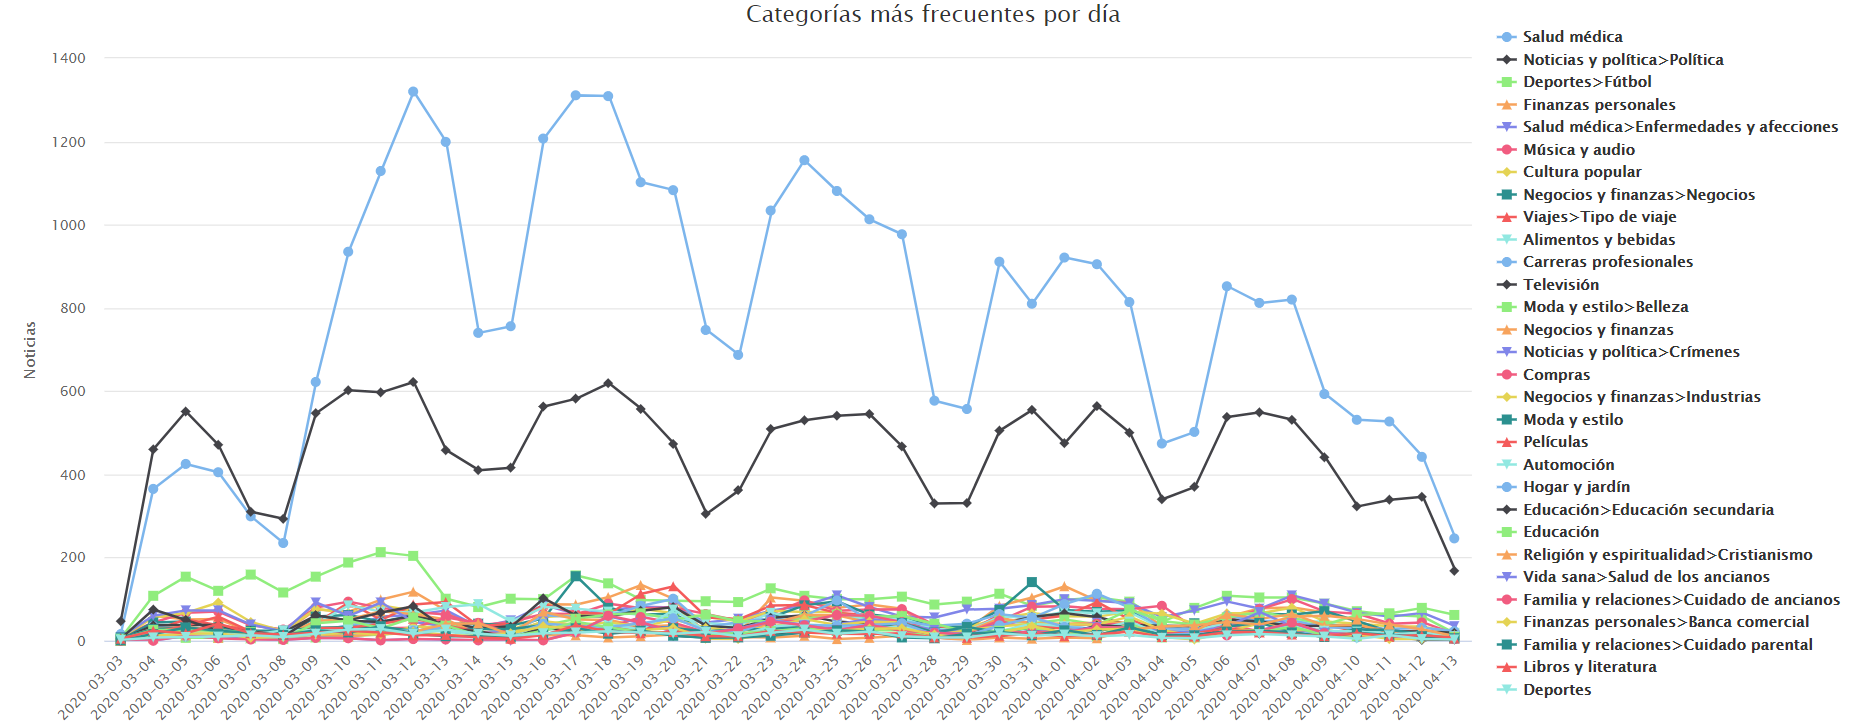
The evolution over time of the most frequent IAB categories are presented in the following figure. In the first days of the month of March, prior to the confinement throughout Spain, subject matter was more varied, but shortly thereafter the theme predominantly dealt with by the media became health and politics/economy.
IPTC model
In this instance, 82 793 news items receive thematic categorization, 73% of the total, even better than that of IAB.
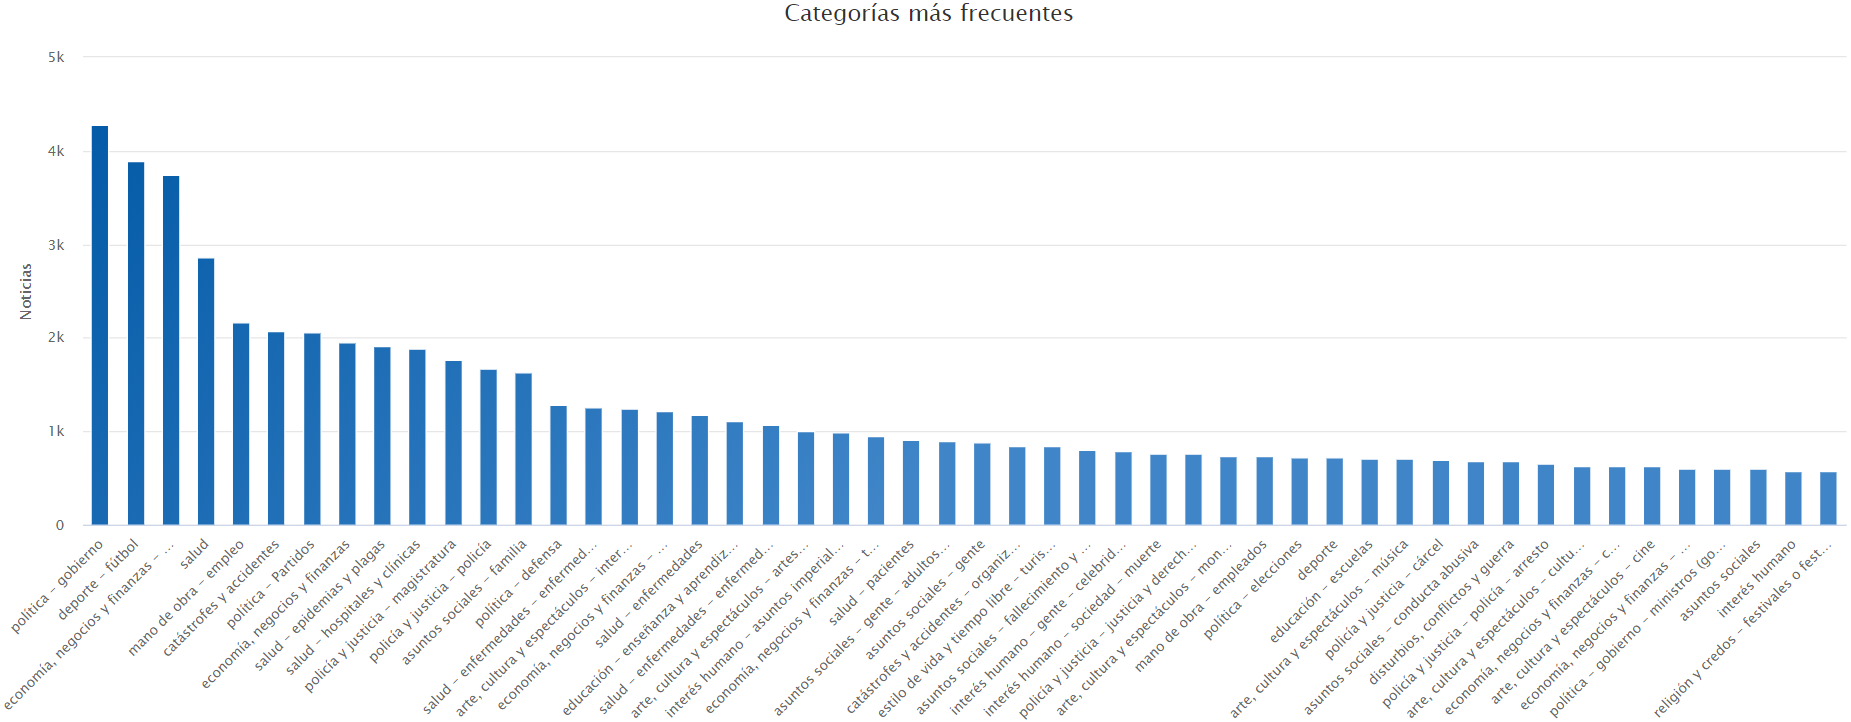
Similarly, the following figure shows the overall thematic distribution of all the news items using the IPTC model. In this case, the categories are more distributed, as IPTC has a much larger number of categories than IAB. The most frequent categories being Politics – Government [Política – Gobierno] (5.0% of the total), Sport – Football [Deporte – Fútbol] (4.7% of the total) and Economy, Business and Finance – Economy (general) [Economía, negocios y Finanzas – Economía (general)] (4.5% of the total), which demonstrates loose thematic overlap with IAB.
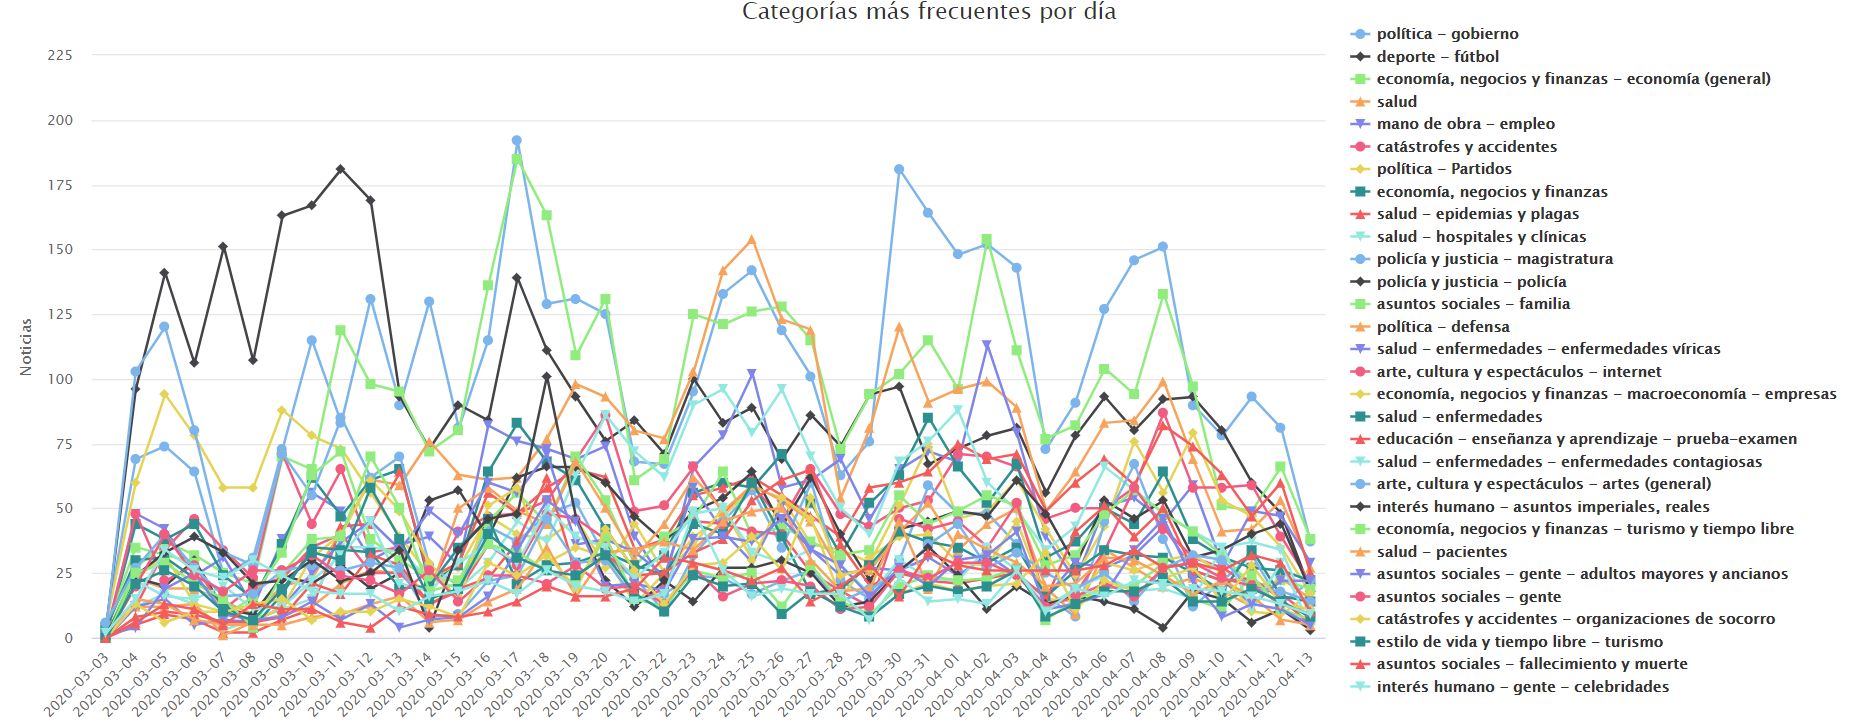
The following figure shows the progressive evolution of the most frequent IPTC categories. It is especially evident that initially the most frequent theme was the cancellation of the League Matches (Sports [Deportes]), which then saw a shift to health, economic and political issues.
Thematic analysis with COVID-19 specific model
While the generic models above provide valuable information on the topics covered by the media, our customization solutions allow us to define specific categorization models in a relatively short period of time and exerting relatively little effort, which are of greater interest for carrying out more focused analyses in specific domains.
Categories of COVID-19 model
For this analysis we have developed a COVID-19 model with the following 78 categories, all related to the context of the coronavirus pandemic:
- Sport
- Physical Exercise
- Sporting Events
- Economy
- Economic Actions
- Social Measures
- Stock Market
- Unemployment
- Debt
- Businesses
- Independent
- Economic Impact
- Oil
- Risk Premium
- Supplies
- Food
- Gas/Light/Electricity
- Tourism
- Environment
- Environmental Impact
- Politics
- Legislative Action
- Political Support
- Closure/Cancellation
- Cancellation of Elections
- Event Cancellation
- School Closure
- Business Closure
- Border Closure
- Transport Closure
- Confinement
- Armed Forces
- Health
- Supplies
- PPE
- Masks
- Medications
- Ventilator
- Overcrowding
- Overcrowded Funeral Homes
- Overcrowded Healthcare System
- Psychological Effects
- Gambling Addiction
- Changes in those affected
- Changes in Those Affected
- Flattening
- Peak
- Recovery
- Pharmacy
- Information
- Research
- WHO
- SupportMeasures
- Expansion Template
- Residencies
- Society
- Cultural Actions
- Social Actions
- Food
- Autistic
- Hoaxes
- Neighborhood Coexistence
- Crime
- Complaints/Infractions
- Reports to Funeral Homes
- Donations
- Education
- Cultural Events
- Pets
- Children
- Leisure
- Acknowledgements
- Teleworking
- Values
- Gender Violence
- Technology
- App
- Telecommunications
- Other themes
When the news does not have anything to do with COVID-19, it remains without a label.
The training of the models is an iterative process, based on a succession of stages from 1) manual labelling (gold standard labelling), 2) rule development, 3) evaluation of precision, 4) extending the gold standard with the model and starting again at stage 2, until the target level of accuracy is reached. The model developed obtains 78% label-based accuracy (see description in Performance Metrics for Text Categorization).
Distribution and thematic evolution
In this case, 61 156 news items are labelled as being related to COVID-19, i.e. 54% of the total receive at least one of the model’s labels.
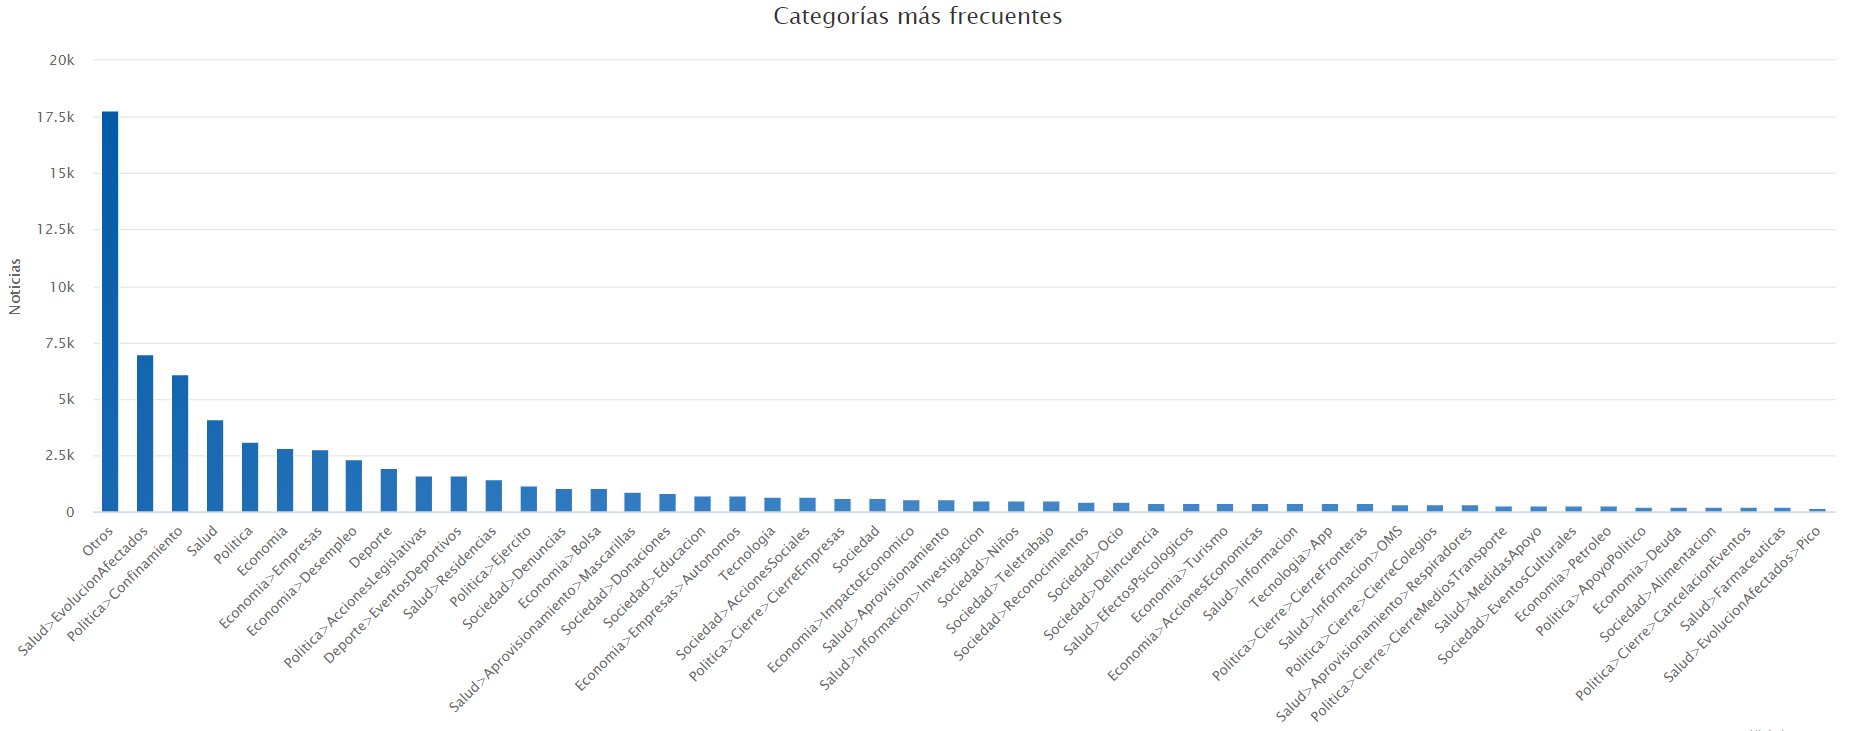
The following figure shows the overall thematic distribution of all the news items in the study period, using this COVID-19 model. It can be observed that, with this specific model, the most frequent categories, apart from Others [Otros], are Health>Changes in those affected [Salud>Evolución de Afectados], Politics>Confinement [Política>Confinamiento] and Health [Salud].
The evolution of the most frequent categories over time are is present in the following graph.
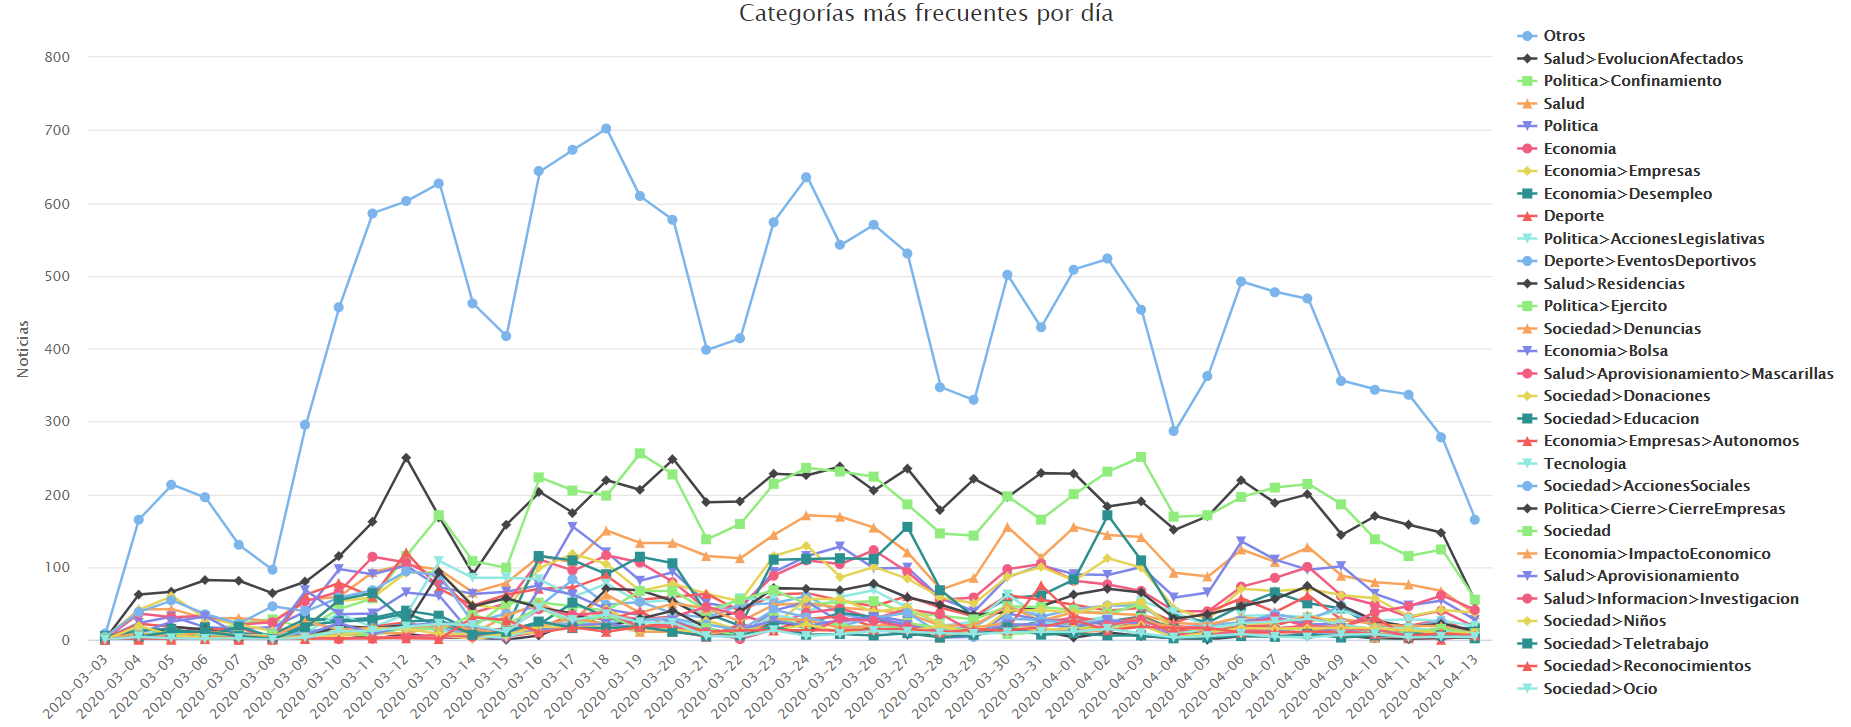
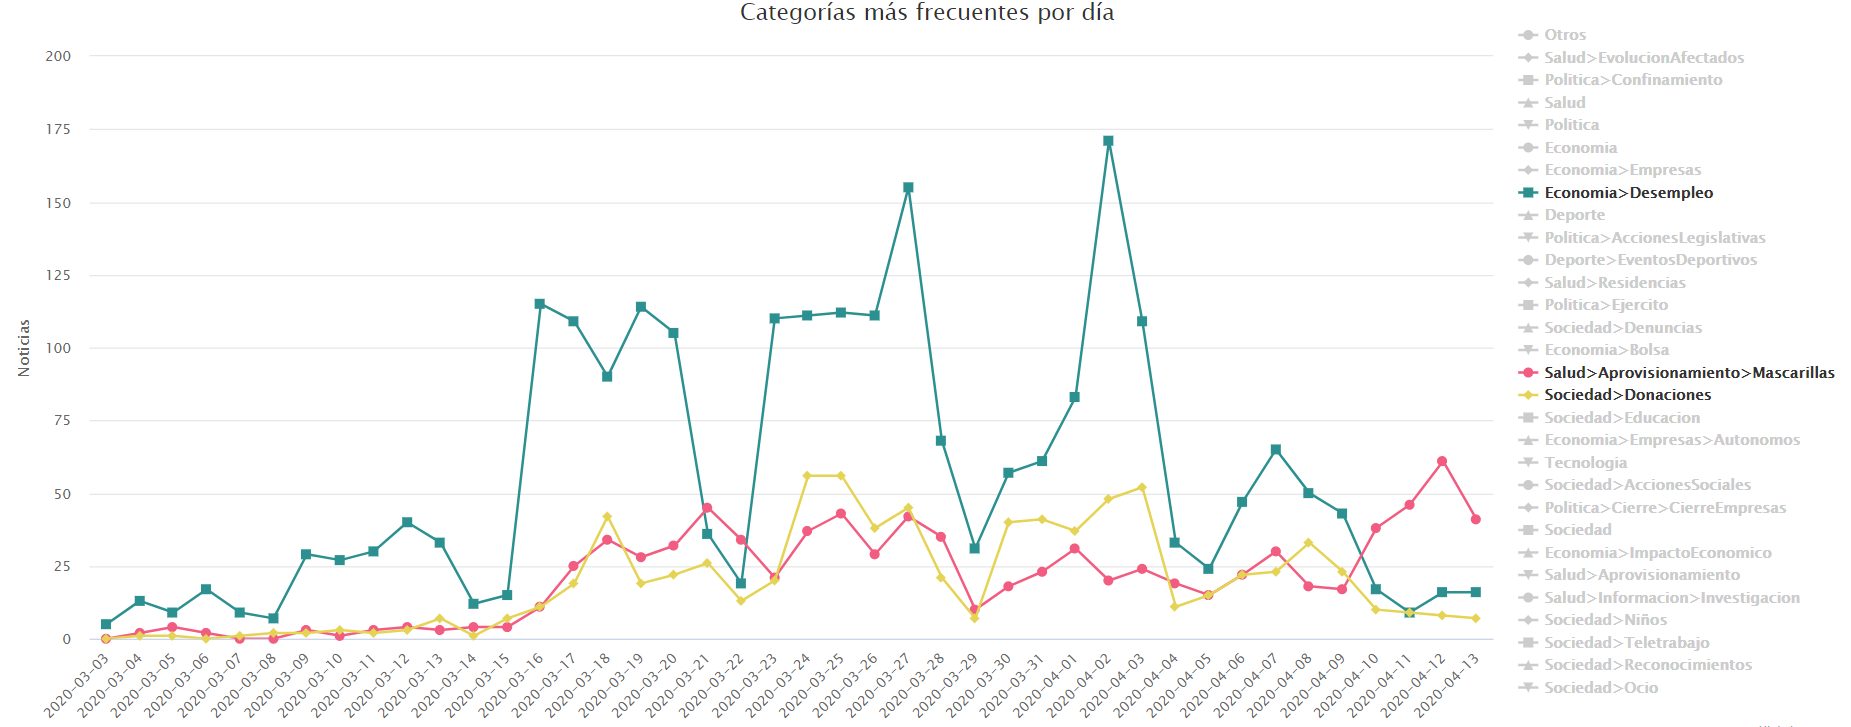
For example, if the analysis centers on three concrete categories, it can be seen (in the following figure) that:
- unemployment [Economía>Desempleo](the rise of unemployment, etc.) has been a huge worry for everyone during this time; with a peak occurring on 2nd April, although it now seems to be lowering.
- the concern about the mask shortages [Salud>Aprovisionamiento>Mascarillas], despite being fairly constant over the last month, has increased due to news about the first signs of “de-escalation” and the possible end of confinement.
- News about donations [Sociedad>Donaciones] were frequent during the central weeks of 23 and 30 March, with a decline in media interest.
Positioning of each media platform
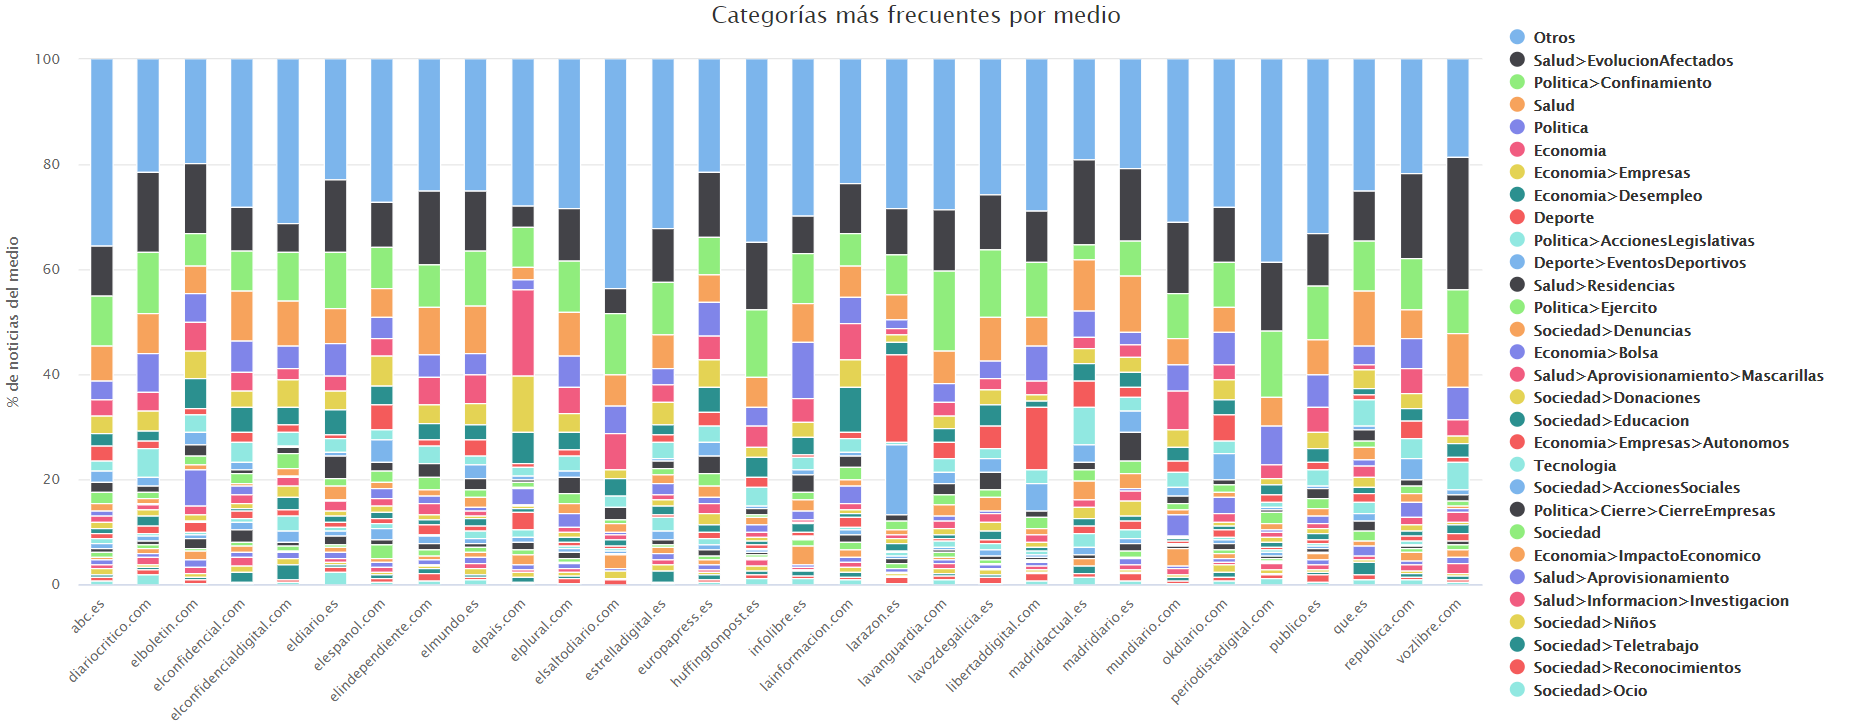
Lastly, another possible analysis is to study the positioning of each media platform. The following figure shows the relative distribution (as a percentage) of themes across each medium relative to the total of news items published by the medium. Conclusions can be drawn about the editorial line of each medium, if more emphasis is placed on aspects of social, economic, or political nature, or alternative themes.
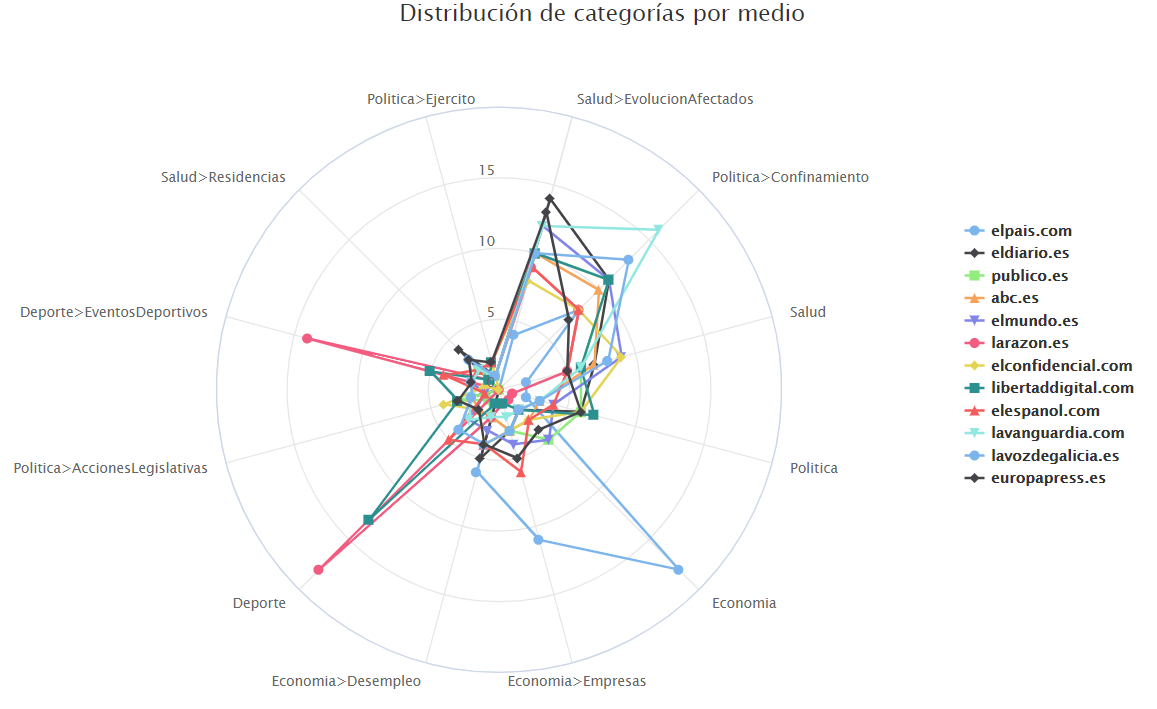
In order to facilitate the comparison, the following figure presents a radar diagram of 12 of the main media platforms, eliminating the Other [Otros] category. For example, the emphasis of El País is placed on economy, that of eldiario.es focuses on health aspects (i.e. changes in those affected, the situation of elderly residents), La Razón published many news items on sports, and La Vanguardia principally concentrates on political aspects of confinement.
Conclusions
Text analysis technology allows us to carry out social research about content published by the media, which may be of interest in distinct lines of study, by automating the analysis of the large volume of information available.
In other posts we will widen the study on this corpus, and we will present other analyses carried out on social network corpora, in particular Twitter [available in Spanish], in Spain and in other countries.
Do you want to know more details about how this study was carried out, or access the data that served as raw material? Contact us at support@meaningcloud.com.
[Translated by Nadine Shallow]
[PS: Webhose has been rebranded as Webz.io.]

