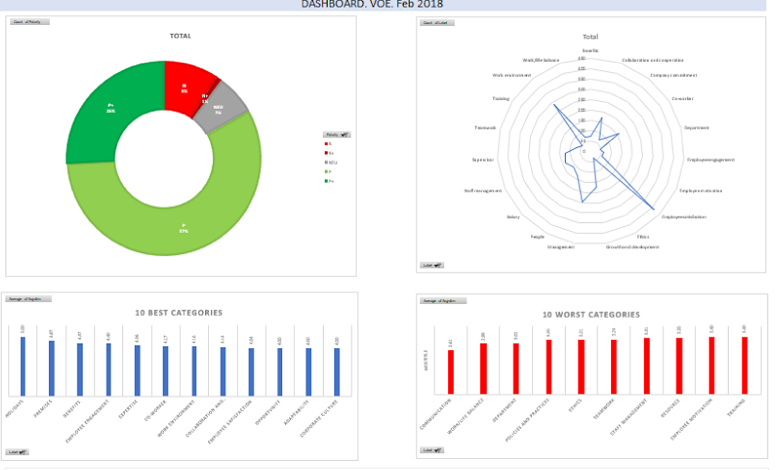
Voice of the Employee gathers the needs, wishes, hopes, and preferences of all employees within an organization. The VoE takes into account both explicit needs, such as salaries, career, health, and retirement, as well as tacit needs such as job satisfaction and the respect of co-workers and supervisors. This post follows the line of Voice of the Customer in Excel: creating a dashboard. We are creating another dashboard, this time for the Voice of the Employee.
Text-based data sources are a key factor for any organization that wants to understand the “whys”.